In this post we are going to install Logstash to finish up our Elasticsearch server. So let’s start. First thing we will do is install Logstash.
sudo apt-get update && sudo apt-get install logstash

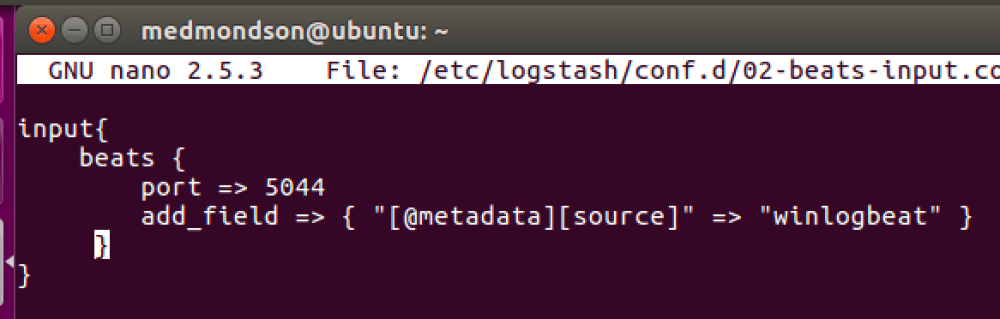
Now we will create our Logstash configuration file to be able to receive event logs from our Windows endpoints with Winlogbeat installed.
sudo nano /etc/logstash/conf.d/02-beats-input.conf

This will create our input configuration file. We will then put in our configurations to be able to receive Winlogbeat data over port 5044.
input{
beats {
port => 5044
add_field => { “[@metadata]” => “winlogbeat” }
}
}
We will now create the output configuration file which will send the aggregated log data to Elasticsearch.
sudo nano /etc/logstash/conf.d/50-elasticsearch-output.conf

Now we will put in the output configuration files.
output {
if [@metadata] => “winlogbeat” {
elasticsearch {
hosts => [“localhost:9200”]
sniffing => true
manage_template => false
index => “%{[@metadata][beat]}-%{+YYYY.MM.dd}”
document_type => “%{[@metadata][type]}”
}
}
}
Now go ahead and start your logstash service and if everything is up and running you should see this.
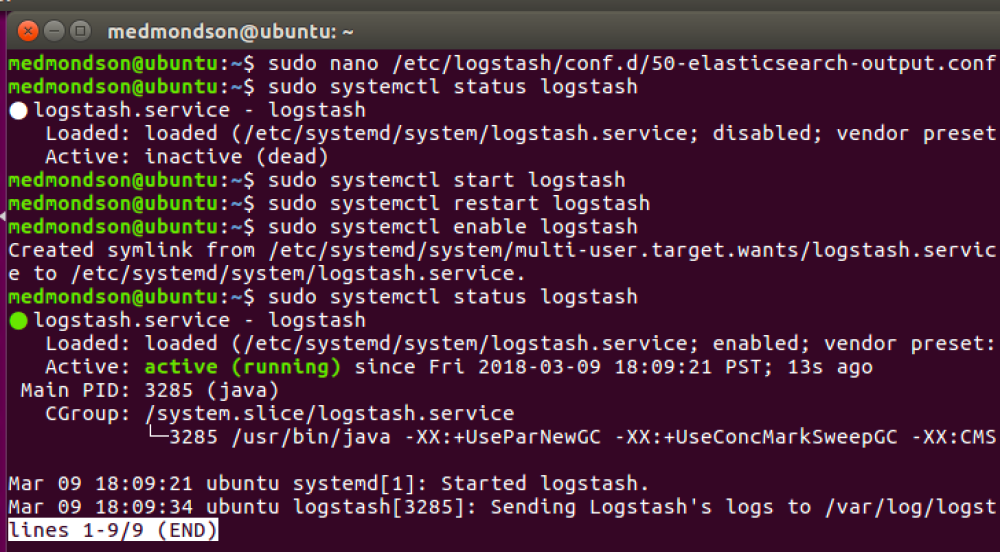
So now you should have a fully functioning Elasticsearch stack ready to accept event logs from a Windows machine. Of course you can create config files to accept bro data, csv’s and etc…
Well I hope you enjoyed this tutorial and until next time…
Happy hunting,
Marcus
